
Case studies from Bulletproof Problem Solving
The book has more than 30 case studies. We show two simple ones here to pique your interest in learning more.
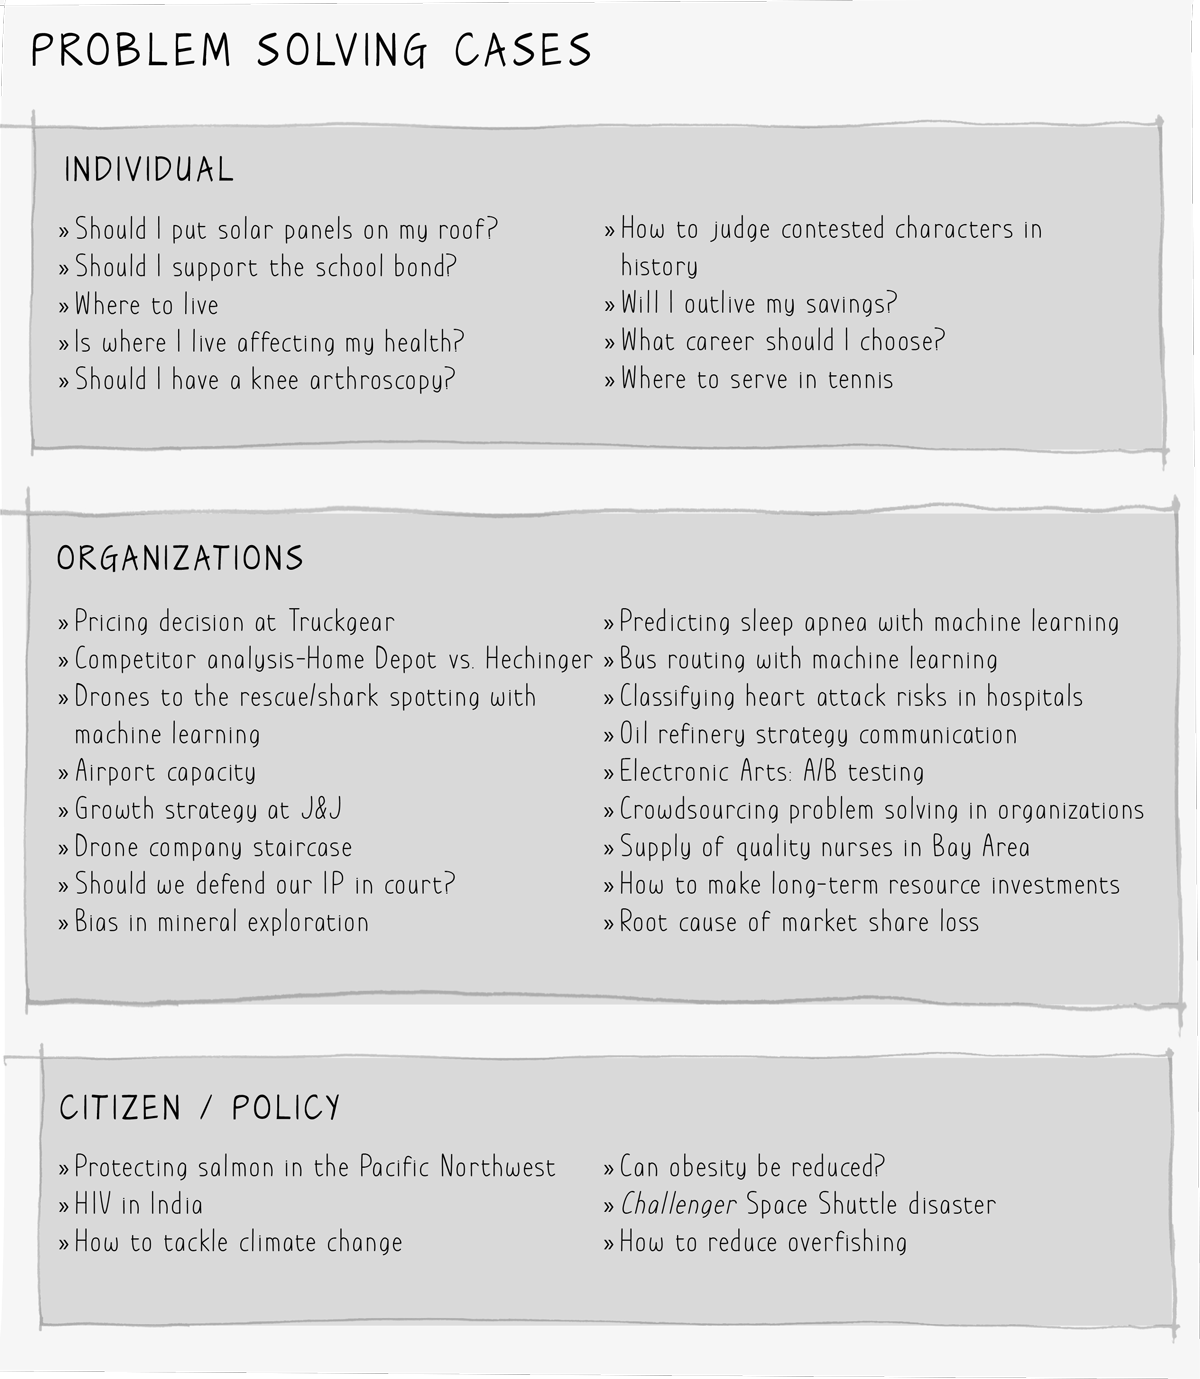
Click to expand and view case studies list
Case Study: Should Rob Install Solar Panels on His Roof Now?
A few years ago Rob thought it might be time to install solar panels at their house in the Australian countryside. Rob and his wife Paula wanted to do something to offset their carbon footprint for some time, but were struggling to make a decision with reducing (and now eliminated) subsidies available from the power company, declining costs of installing solar PV, and questions over the future level of feed-in tariffs (the price at which the electricity company buys from you when you generate excess power at home). Was now the right time? He decided to approach it in the way he had learned at McKinsey and started with the hypothesis, “We should install solar PV now.” He hadn’t reached a conclusion by framing it this way, nor was he setting out to confirm it without regard to the facts. He was using the hypothesis to bring forth the arguments to either disprove it or support it.

Rob felt that the hypothesis would be supported if the following criteria could all be sustained:
- If the payback on the investment was attractive, something less than 10 years.
- If the decline in the cost of panels was slowing down such that he should not wait and make the investment later at substantially lower cost. Rob felt that if solar panel costs were going to continue to decline and be significantly cheaper in three years he’d consider waiting.
- If the reduction in his CO2 footprint was material, by which he meant 10% or more (other than air travel he is required to do and can offset independently).
Rob knows that constraining the scope of the problem with clear boundaries makes problem solving more accurate and speedy (step 1).
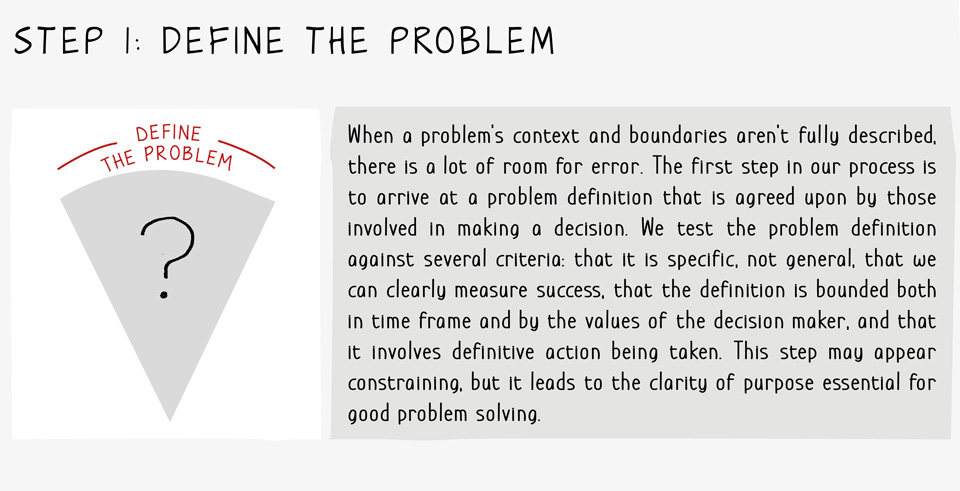
Step 1: Define the Problem
This kind of problem sounds quite complex at first, a jumble of unfamiliar terms like feed-in tariffs and avoided carbon. A logic tree helped Rob see the structure of his problem in one picture, and helped him break up the analyses into manageable chunks. He started by laying out the reasons and supporting facts that he would need to resolve the issue. You can also think of it this way—for Rob to answer the question affirmatively what would he have to be convinced of? What are the major reasons for going ahead and installing solar panels?
Exhibit 1.5 is a first cut of Rob’s logic tree (steps 2 and 4).
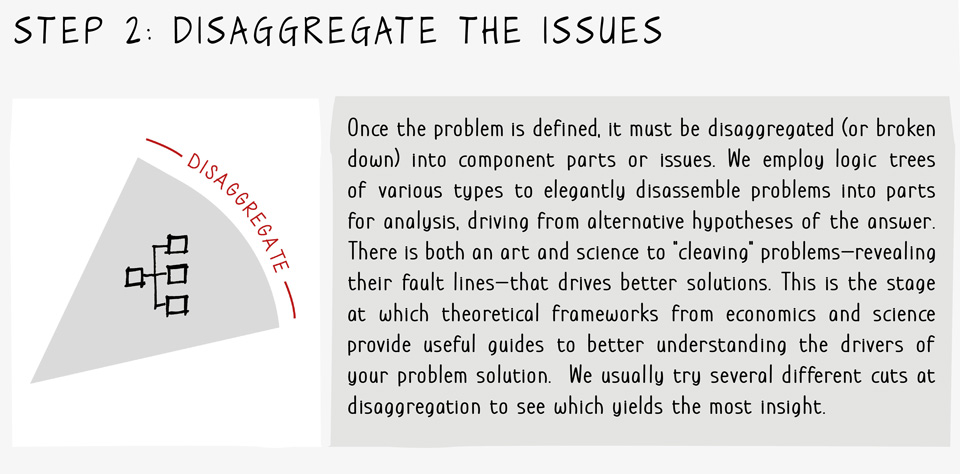

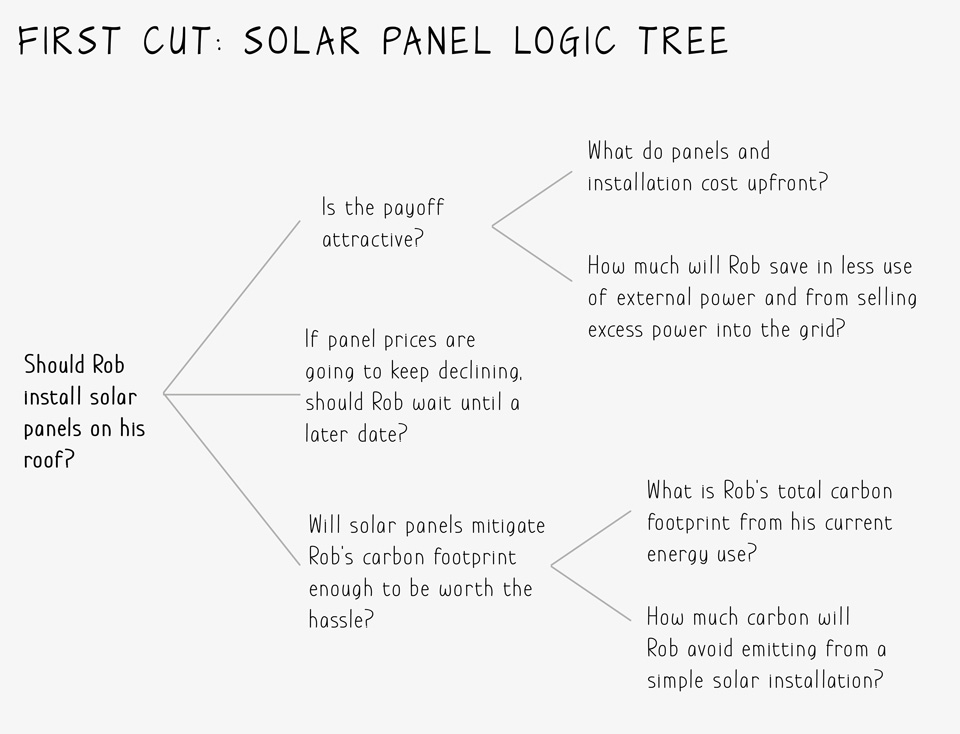
Exhibit 1.5
The first part he tackled was payback, because if the economics didn’t work, the two other questions didn’t need answering. Payback is pretty straightforward: the cost of the installed solar panels and inverter, divided by the annual electrical cost savings. The denominator in this analysis includes both estimating net savings from the installation from avoided electricity charges because he was using his own power, plus income from supplying electricity to the grid via feed-in tariffs. Most of this analysis can be done by online calculators that solar installers offer, once you know the size of the system, roof orientation, solar electric potential and the efficiency in power generation. Rob simplified the analysis by leaving out battery storage options that add to cost but provide the opportunity to replace peak power charges. With an annual cost savings of around $1,500 and investment costs of just over $6,000, payback was attractive at about four years (step 5).
The next question was whether he should make the investment now, or wait, hoping for lower solar panel costs later. Rob was aware that the cost of a watt of PV had fallen almost 30% from 2012 to 2016, and almost 90% from the early days of solar PV. He wasn’t sure whether this would continue in the future. With some simple Internet research, Rob learned that declining costs of equipment was still uncertain, but the cost per watt was unlikely to fall by more than 30% for at least the next three years. There is also uncertainty about future feed-in tariffs that have been set to encourage sales of solar PV. This has to be considered against rising retail prices for electricity customers.
At $1,500 per year, the cost savings lost by waiting would be $4,500 over three years, so the upfront cost of the solar PV installation would have to fall by 75% to make waiting worthwhile. Rob could have used a net present value analysis where the time value of money is considered rather than a simple payback. But in this case the simple method is fine: He felt comfortable that the four-year payback providing an implied rate of return of 25%. It was worth doing now.
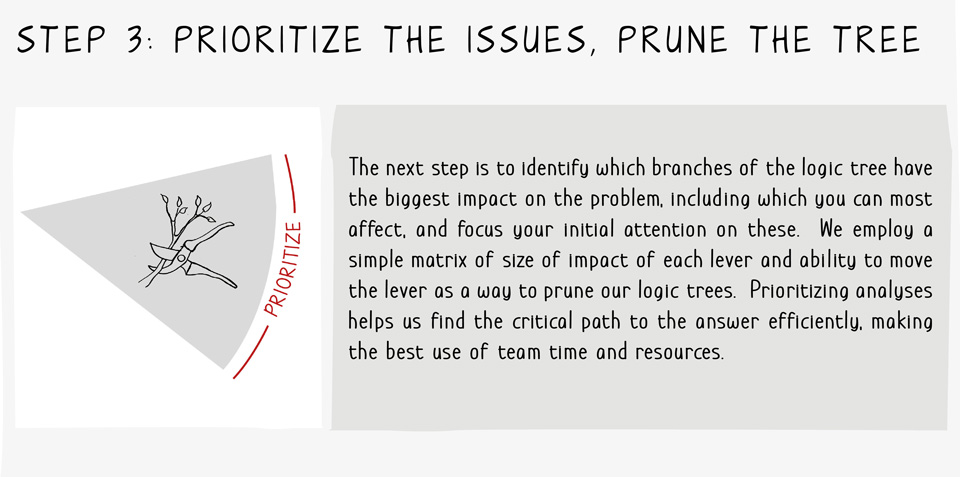
Finally, he wanted to estimate how much of his CO2 footprint he would reduce by going ahead. This depends on two things—one is what fuel source he is displacing (coal or gas in this case) and the second is the kilowatt hours (kWh) he is generating compared to his electricity use, which he knew from the first step. Rob simplified the analysis by looking at the carbon footprint of the average Australian citizen, and found that the avoided carbon from his little solar project could reduce his footprint by more than 20%. Since the payback as an investment is very solid in this case, Rob really could have pruned off this branch of the tree (step 3) and saved some time—but he and Paula had multiple objectives with this investment.
Whenever you do this kind of analysis it is worth asking what could go wrong, what are the risks around each part of the thinking? In this case there is a chance that the power company would reduce the subsidies for installing solar PV. This can be mitigated by acting quickly. The power company could also reduce the feed-in tariff rate at which it purchased any excess power produced by Rob—and in fact they did that later. But with a four-year payback the exposure is reasonably limited.
The result of Rob’s analyses is shown in the more complicated tree shown in Exhibit 1.6.
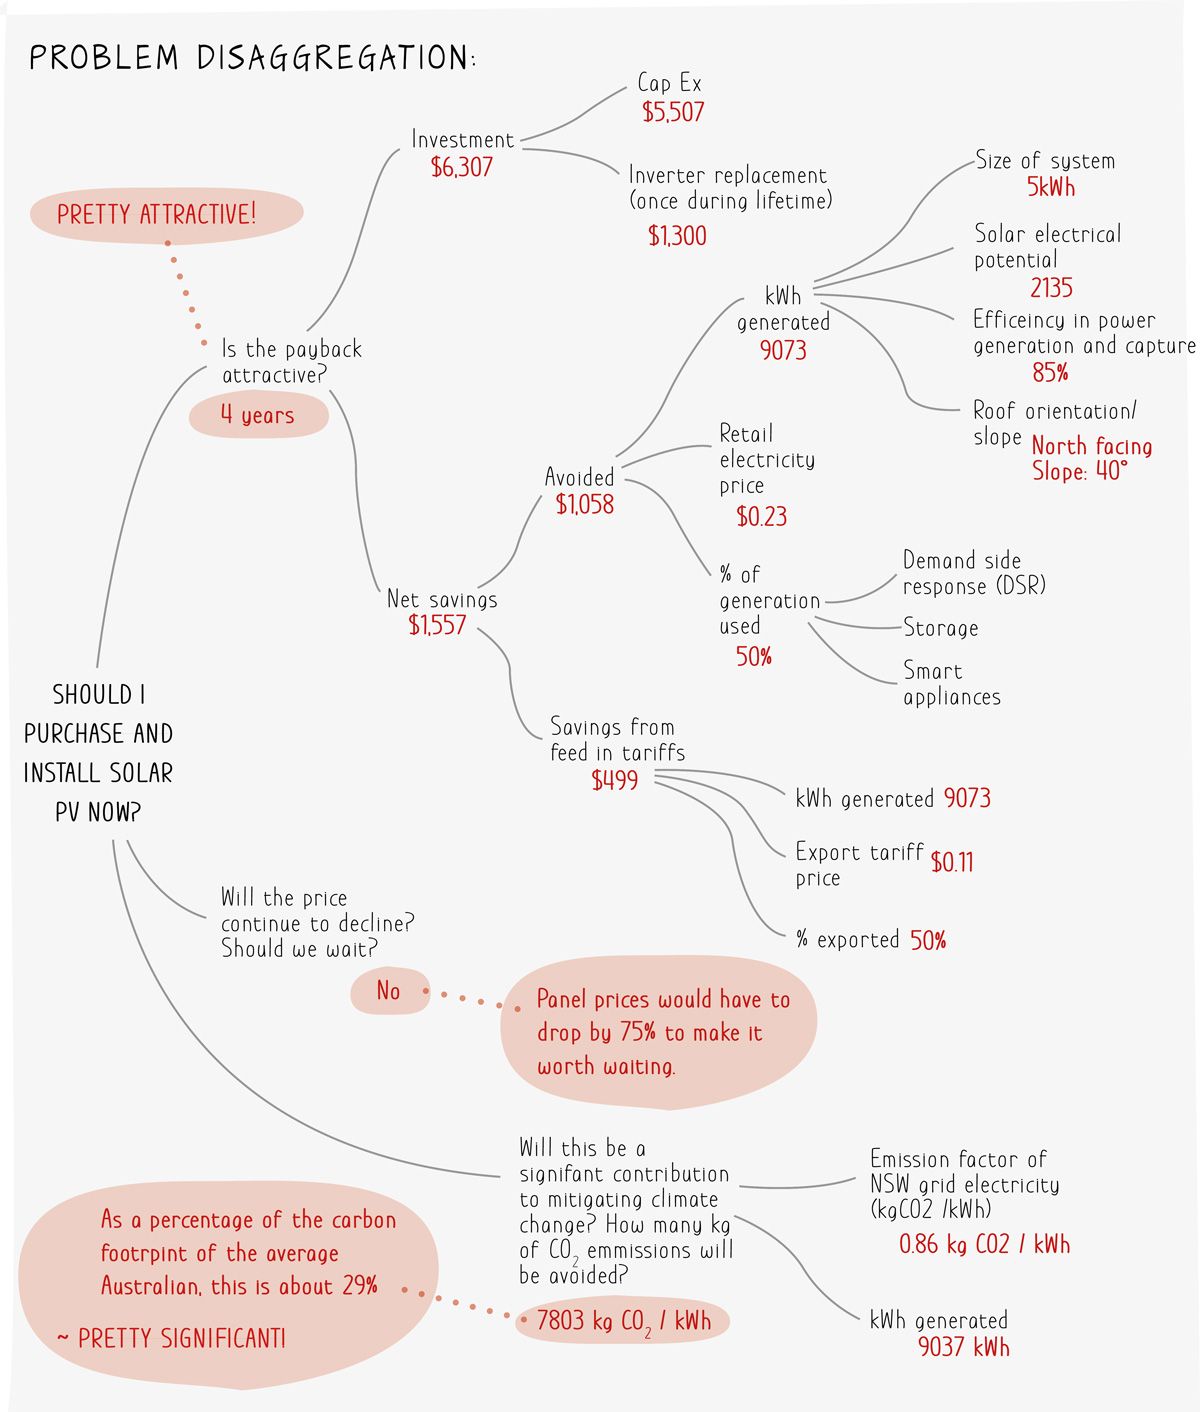
Assumptions: House type: detached bungalow, Roof orientation: north, Slope: 40°, Suitable roof area: 40m2, Installation size: 5kWh, Shading: none, Numbers for calculations are from 2017, Australia.
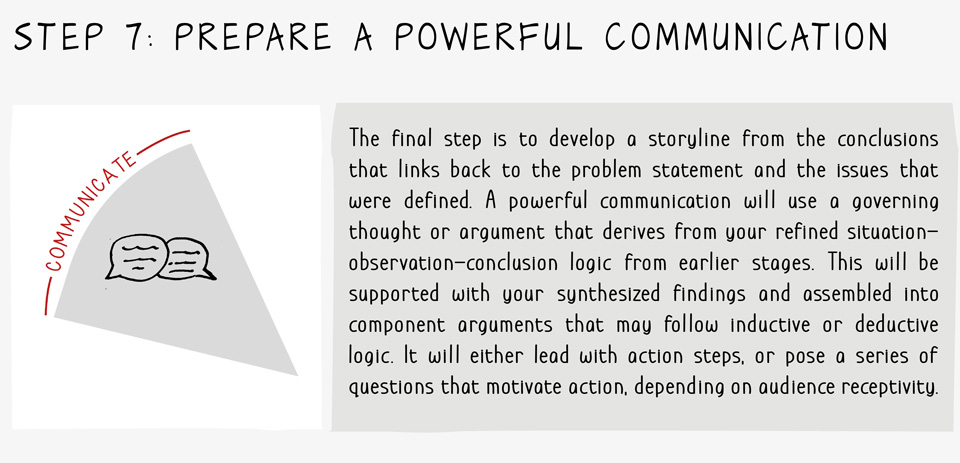
With only a bit of online research, Rob was able to crack a relatively complicated problem. Rob should install solar panels now: The payback is attractive, and likely cost declines to install later are not enough to offset the savings he could earn now. As a bonus, Rob and Paula were able to reduce their carbon footprint by nearly 30% (steps 6 and 7).
The core of this good result was asking the right questions and disaggregating the problem into straightforward chunks.
Case Study: Making Pricing Decisions in a Start-up Company
In the past few years, one of Charles’s friends started a company that makes an accessory for pick-up trucks that has a unique and clever design. The company, which we’ll call Truckgear, sells around 10,000 units a year, a number that is growing quickly. It is at breakeven on a cash basis (cash basis means not taking into account the accounting charge for depreciating assets). Charles invested in the company and helps devise its strategy.
Start-up companies face big and complex problems early on in the process and, compared to larger companies, they have limited cash resources and team members to address them. Truckgear had to make decisions on whether it should own its own manufacturing plant, which market segments to compete in (there are new and used truck segments and several sales channels to each), whether it should have its own sales force, how much to spend on marketing, and most fundamentally, how fast to grow given limited cash? No wonder start-up teams hardly sleep!
Recently the company had a big decision to make: Should it raise its prices (step 1)? It had held its initial pricing of around $550 for three years. Materials and manufacturing costs had increased as the product features were improved, crimping its margins and lowering the cash generated per unit. Obviously in young companies cash is even more critical than in established ones, as the sources of external financing are significantly fewer. The dilemma Truckgear faced was this—if the marketplace reacts negatively to the price increase, Truckgear growth would slow and perhaps even drop in unit sales?
There is no perfect answer to this kind of question, but we employed a particular kind of logic structure to assess it, a profit lever tree (step 2). We wanted to hone in on the key factors around the decision, and this kind of tree is mathematically complete, so we could use it to model different assumptions.
Exhibit 1.10 is a simple version of this kind of tree.
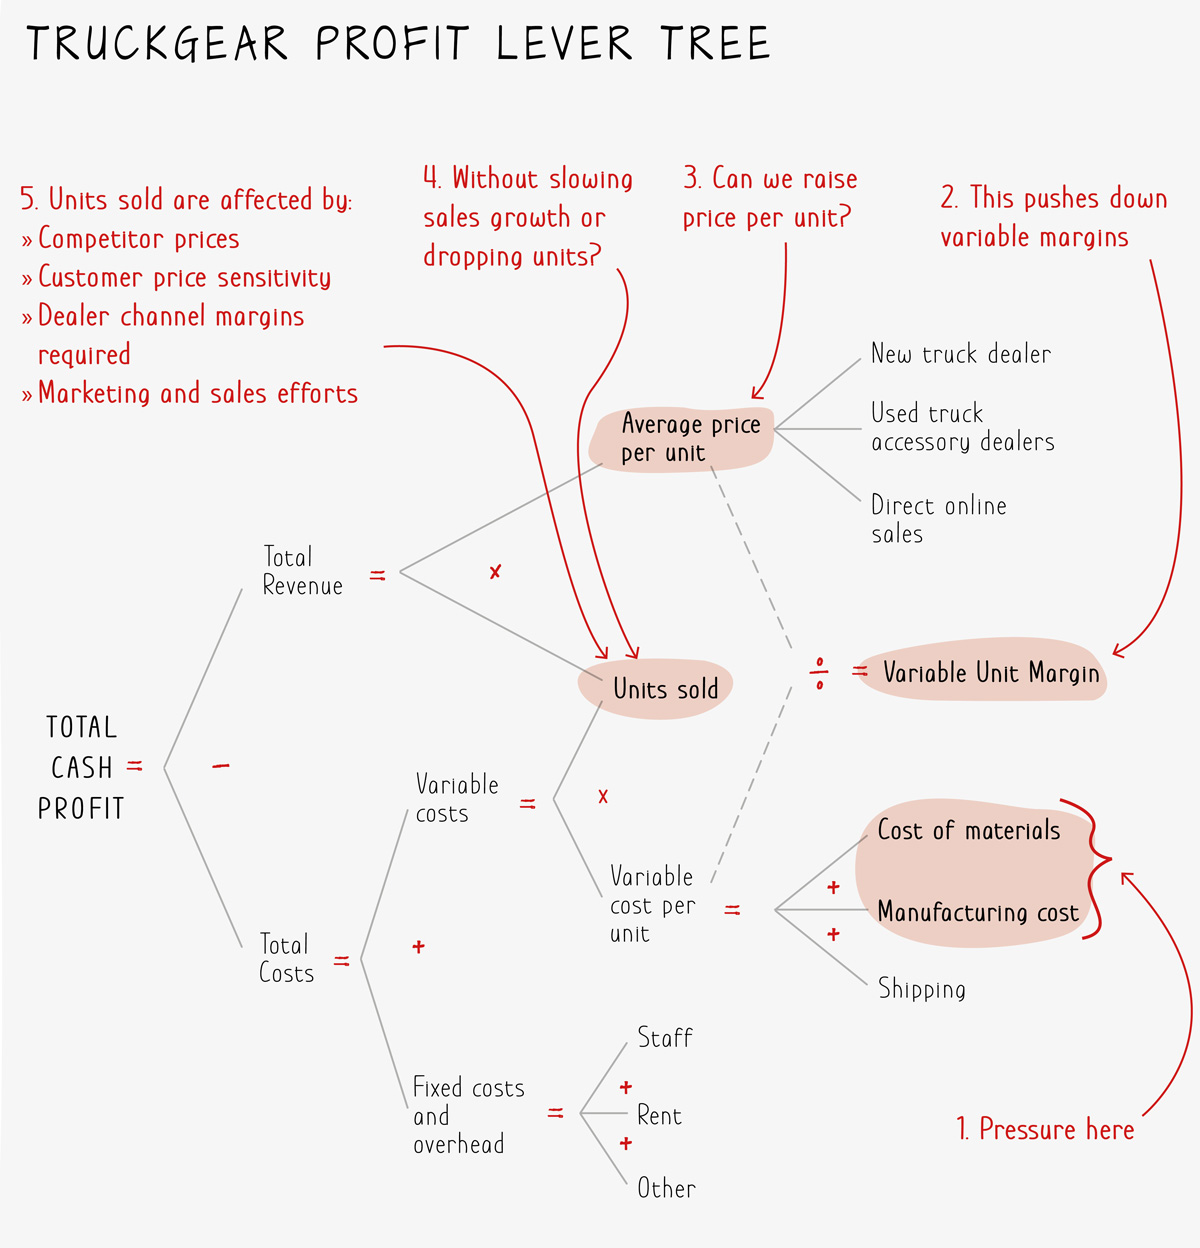
Exhibit 1.10
You can see how the tree makes Truckgear’s problem visual: Pressure on costs pushes down variable margin per unit—can the company increase unit prices without slowing sales growth or even dropping volume?
Exhibit 1.11 displays the numbers for Truckgear.
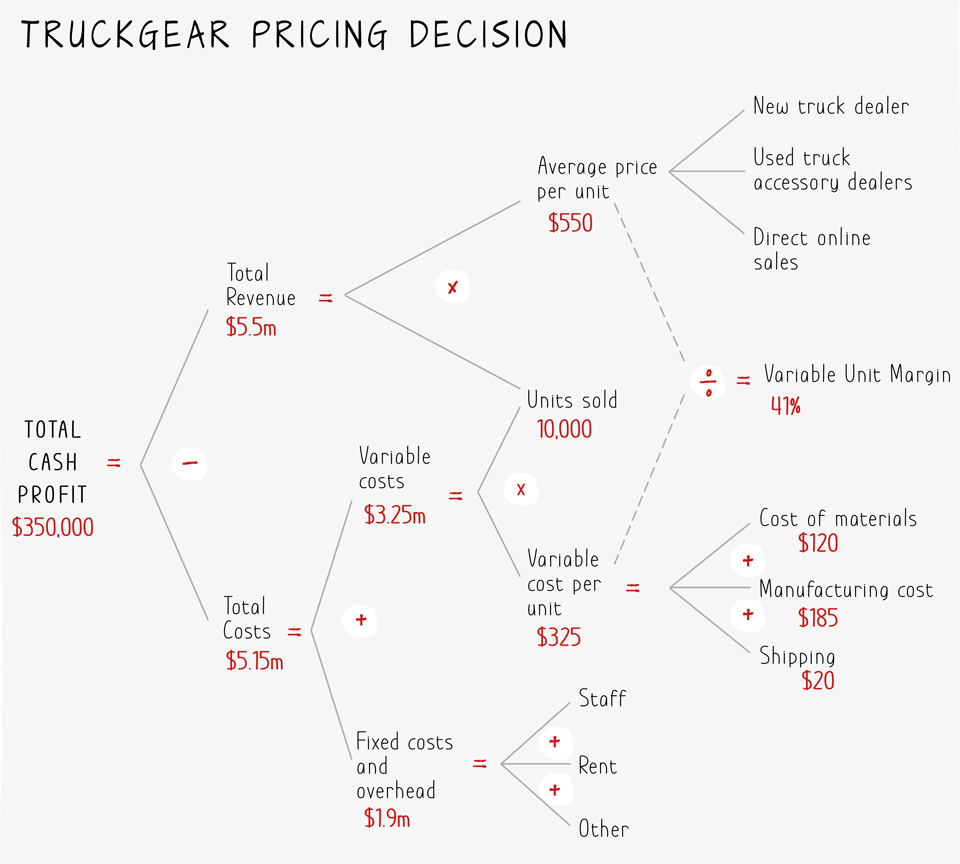
Exhibit 1.11
If the company could hold its current unit sales, a price increase of 7% would yield a $385,000 improvement in cash profitability, a substantial increase that could help fund additional marketing and sales programs. But you can also see that it would only take a drop in unit sales of 650 to neutralize the benefit of the price increase (step 5). What to do?
Whether a price increase leads to a loss in total cash profit (or, less seriously, slowing of growth) depends on competitor pricing, customer price sensitivity (which economists call price elasticity), whether the third-party dealer sales channels will absorb some of the price increase by accepting lower margins, as well as marketing and sales efforts. The company initiated a large phone survey of its recent customers and determined that:
- The largest volume customer segments were not sensitive to a modest cost-based increase.
- The competitor products were roughly comparable in price and quite different in functional characteristics.
- Dealers were not willing to reduce their margins to accommodate the price increase.
The company also evaluated whether it could achieve the same result by reducing its fixed overheads or taking manufacturing in-house. With few costs other than a lean staff and rent, the first was not an option. With limited current cash resources, investing in its own extremely expensive manufacturing presses and assembly also didn’t make sense (step 3). On balance a small price increase to restore unit margins was worth the risk (step 6 and 7).
This kind of financial tree is particularly useful for solving problems that involve monetary trade-offs of alternative strategies. You can use it to track almost any kind of business problem.
